How do you turn complex global data into local insight at scale?

Challenge
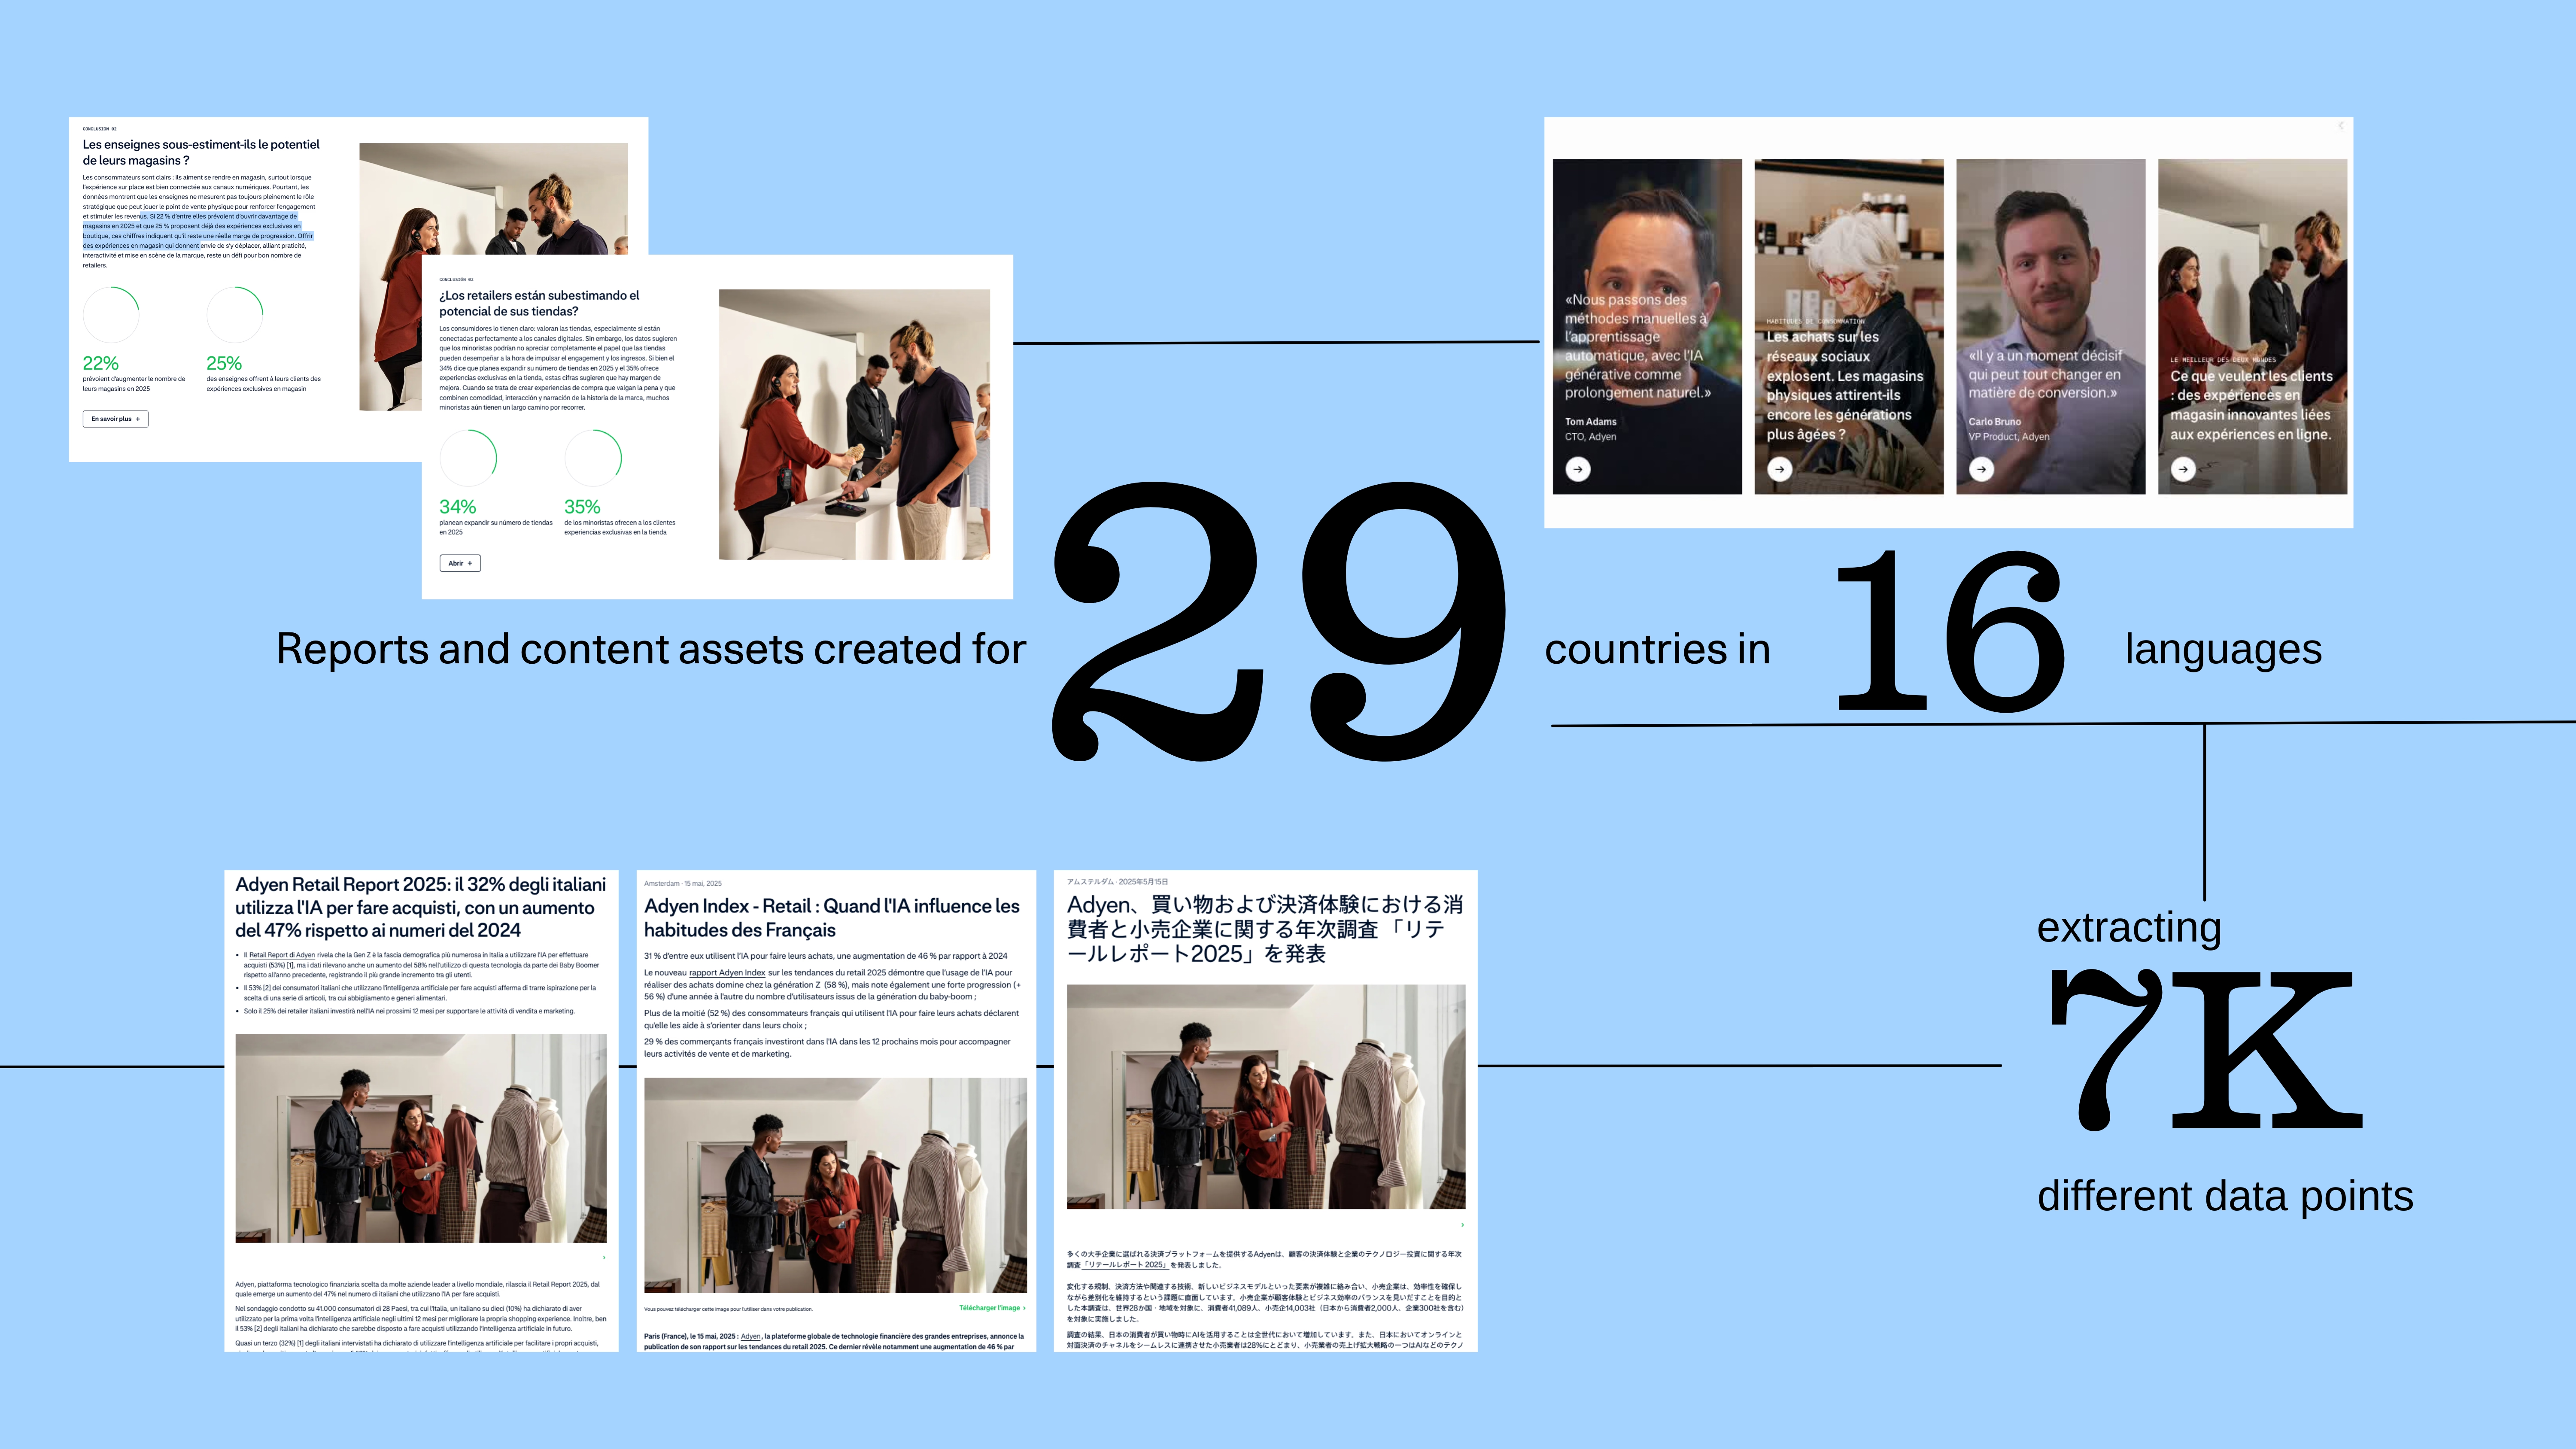
Each year, the client produces multiple index reports based on extensive global research, drawing on data from approximately 14,000 merchants and around 40,000 consumers across 29 markets and multiple industry verticals.
While the research itself was robust, translating it into usable narratives for local markets was not. Localisation relied on a fully manual process, with teams working directly from large, text-heavy spreadsheets containing thousands of rows and columns. Content was rewritten, reformatted, and reviewed market by market.
As the scale increased, this approach became slow, resource-intensive, and error-prone. It placed a heavy administrative burden on both global and local teams, particularly during review and approval cycles. The client recognised there had to be a better way to manage this process, but did not have a clear model for how to change it.
Our approach
Rather than automating isolated tasks, we set out to redesign how global research moved through the organisation end-to-end. The aim was simple but ambitious: enable scale without sacrificing accuracy, judgement, or control.
Establishing a human-led foundation
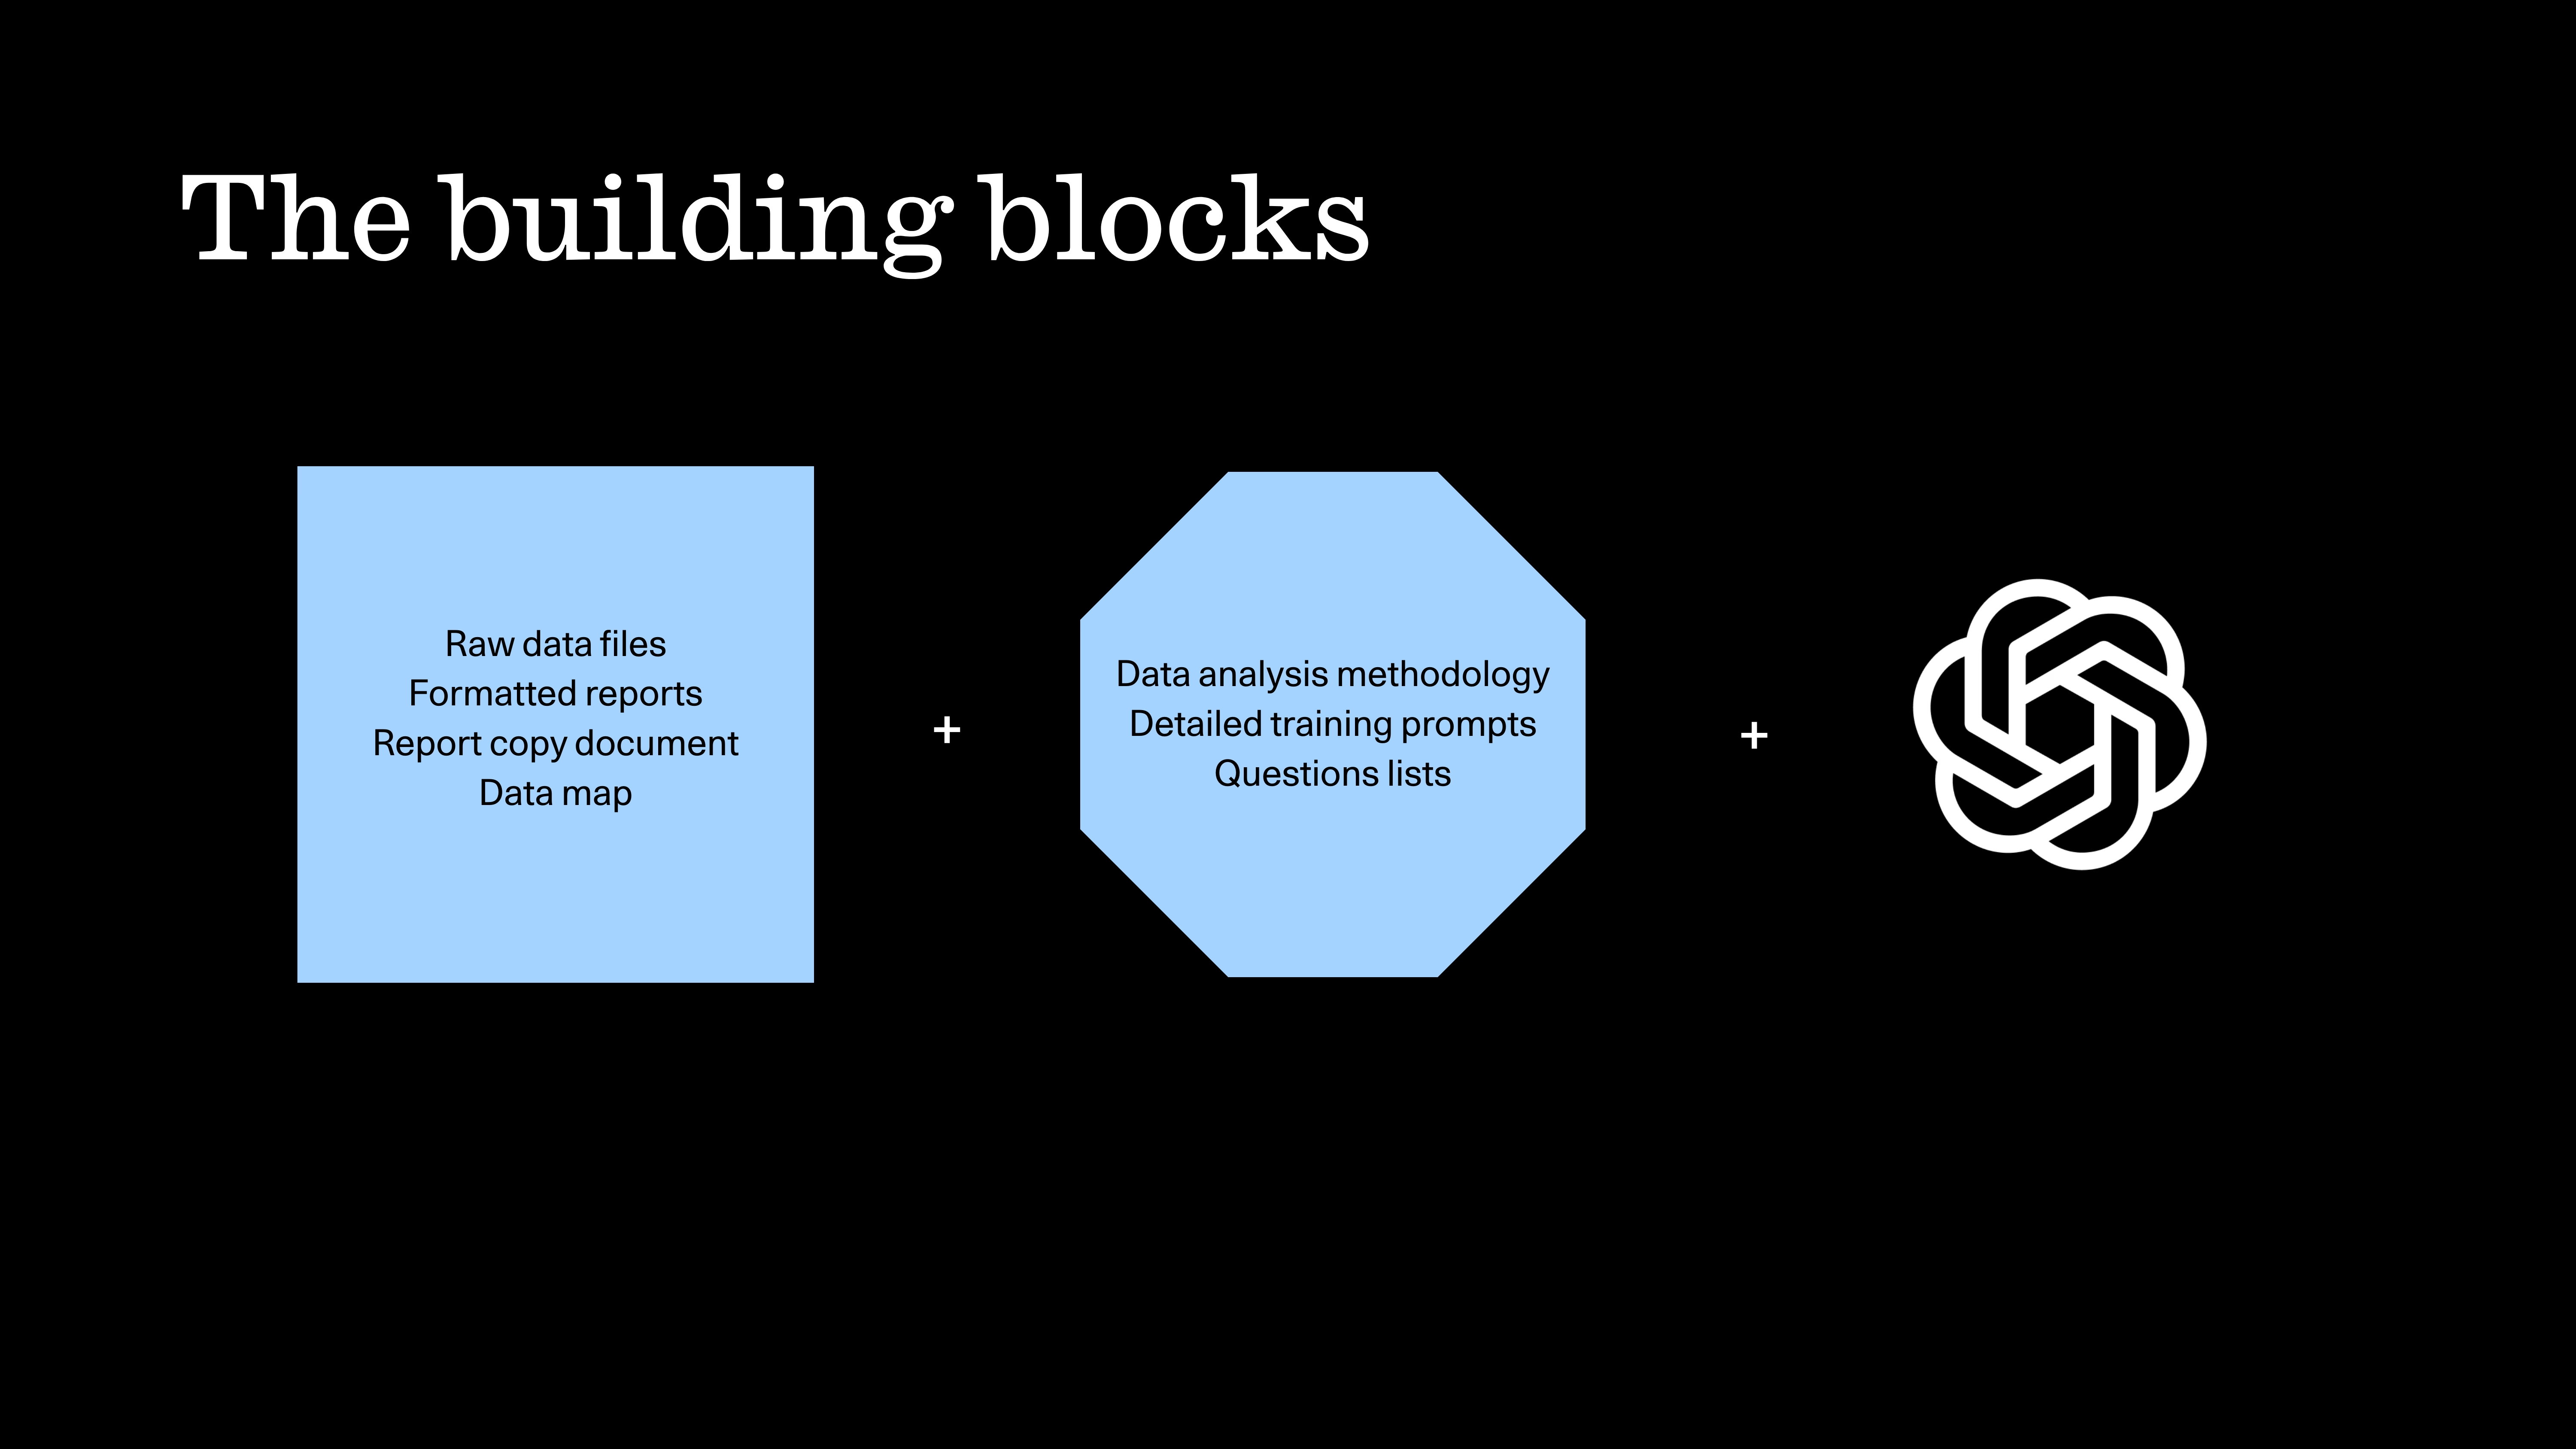
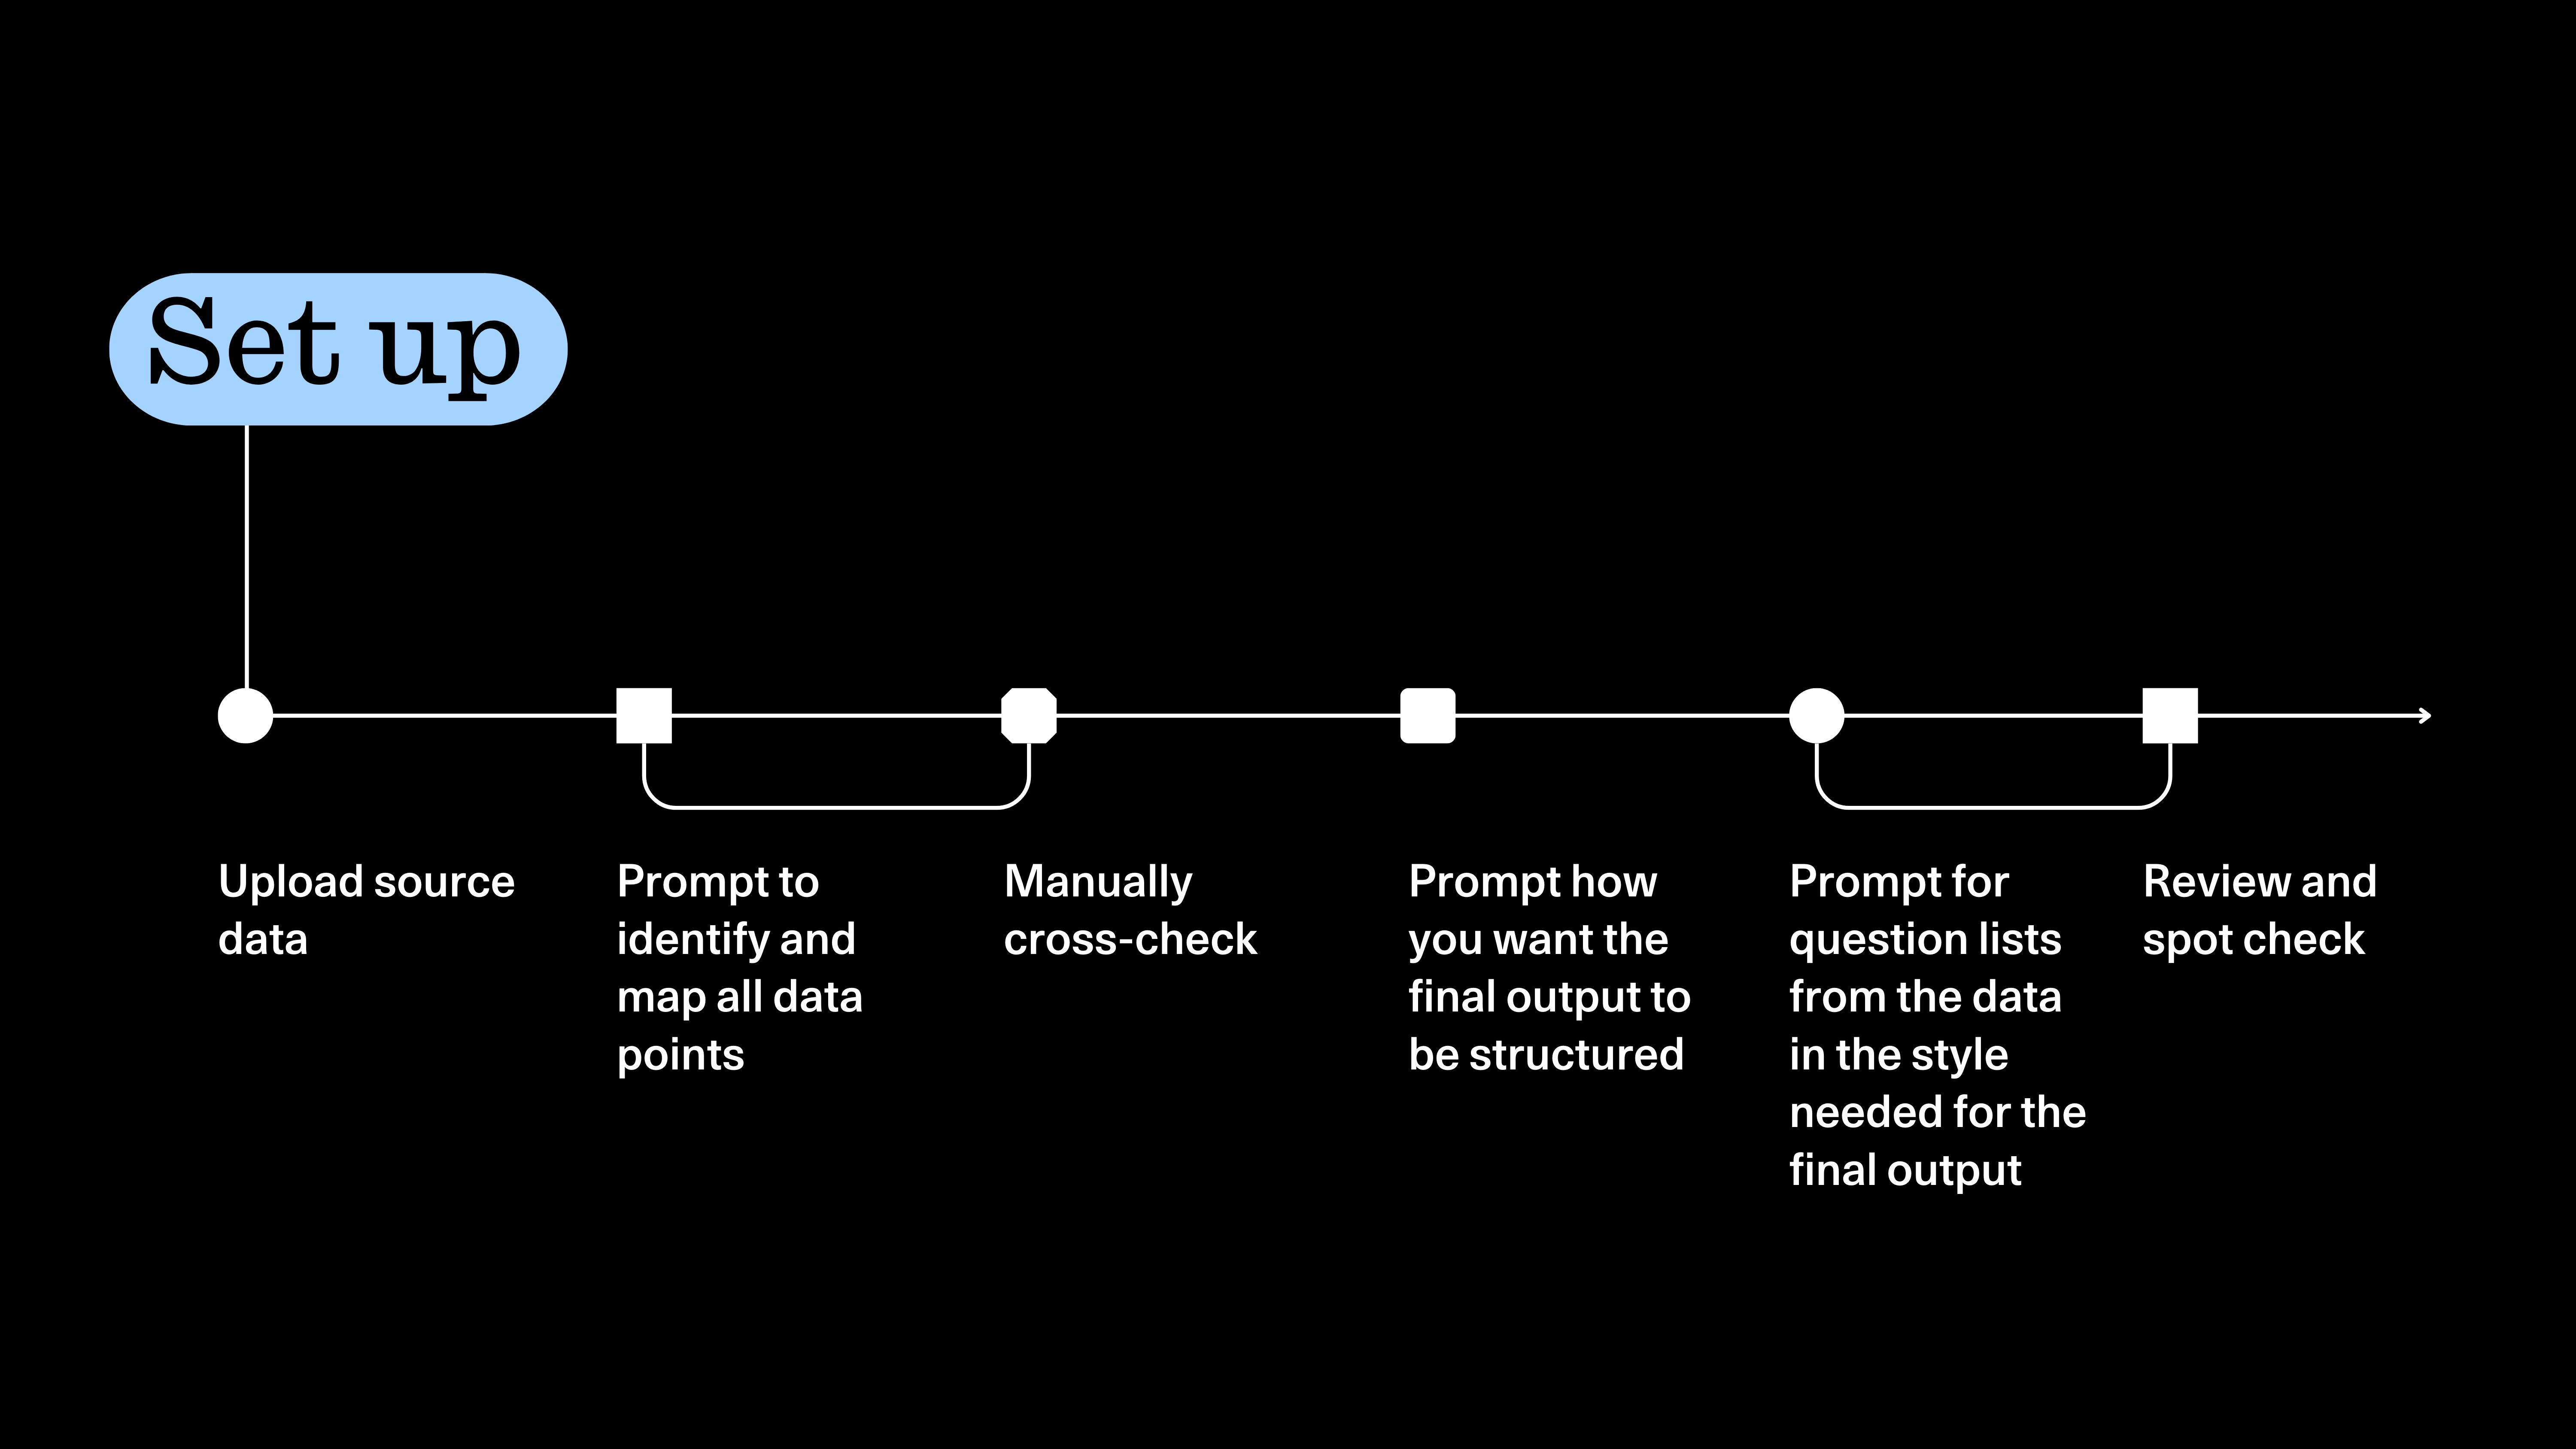
- We assembled all verified inputs, including raw research data files supplied by the research firm, and interpreted previous index reports to anchor structure, tone, and format.
- From there, we defined a clear methodology for how the data should be analysed and translated into narrative outputs.
- This included developing data maps explaining how the datasets should be read by the large language model (LLM) and developing structured question frameworks and training prompts that reflected how experienced communicators interrogate complex datasets.
This setup phase was deliberately human-led and iterative, grounded in editorial and data analyst judgement, context, and accountability.
Embedding AI into execution and testing
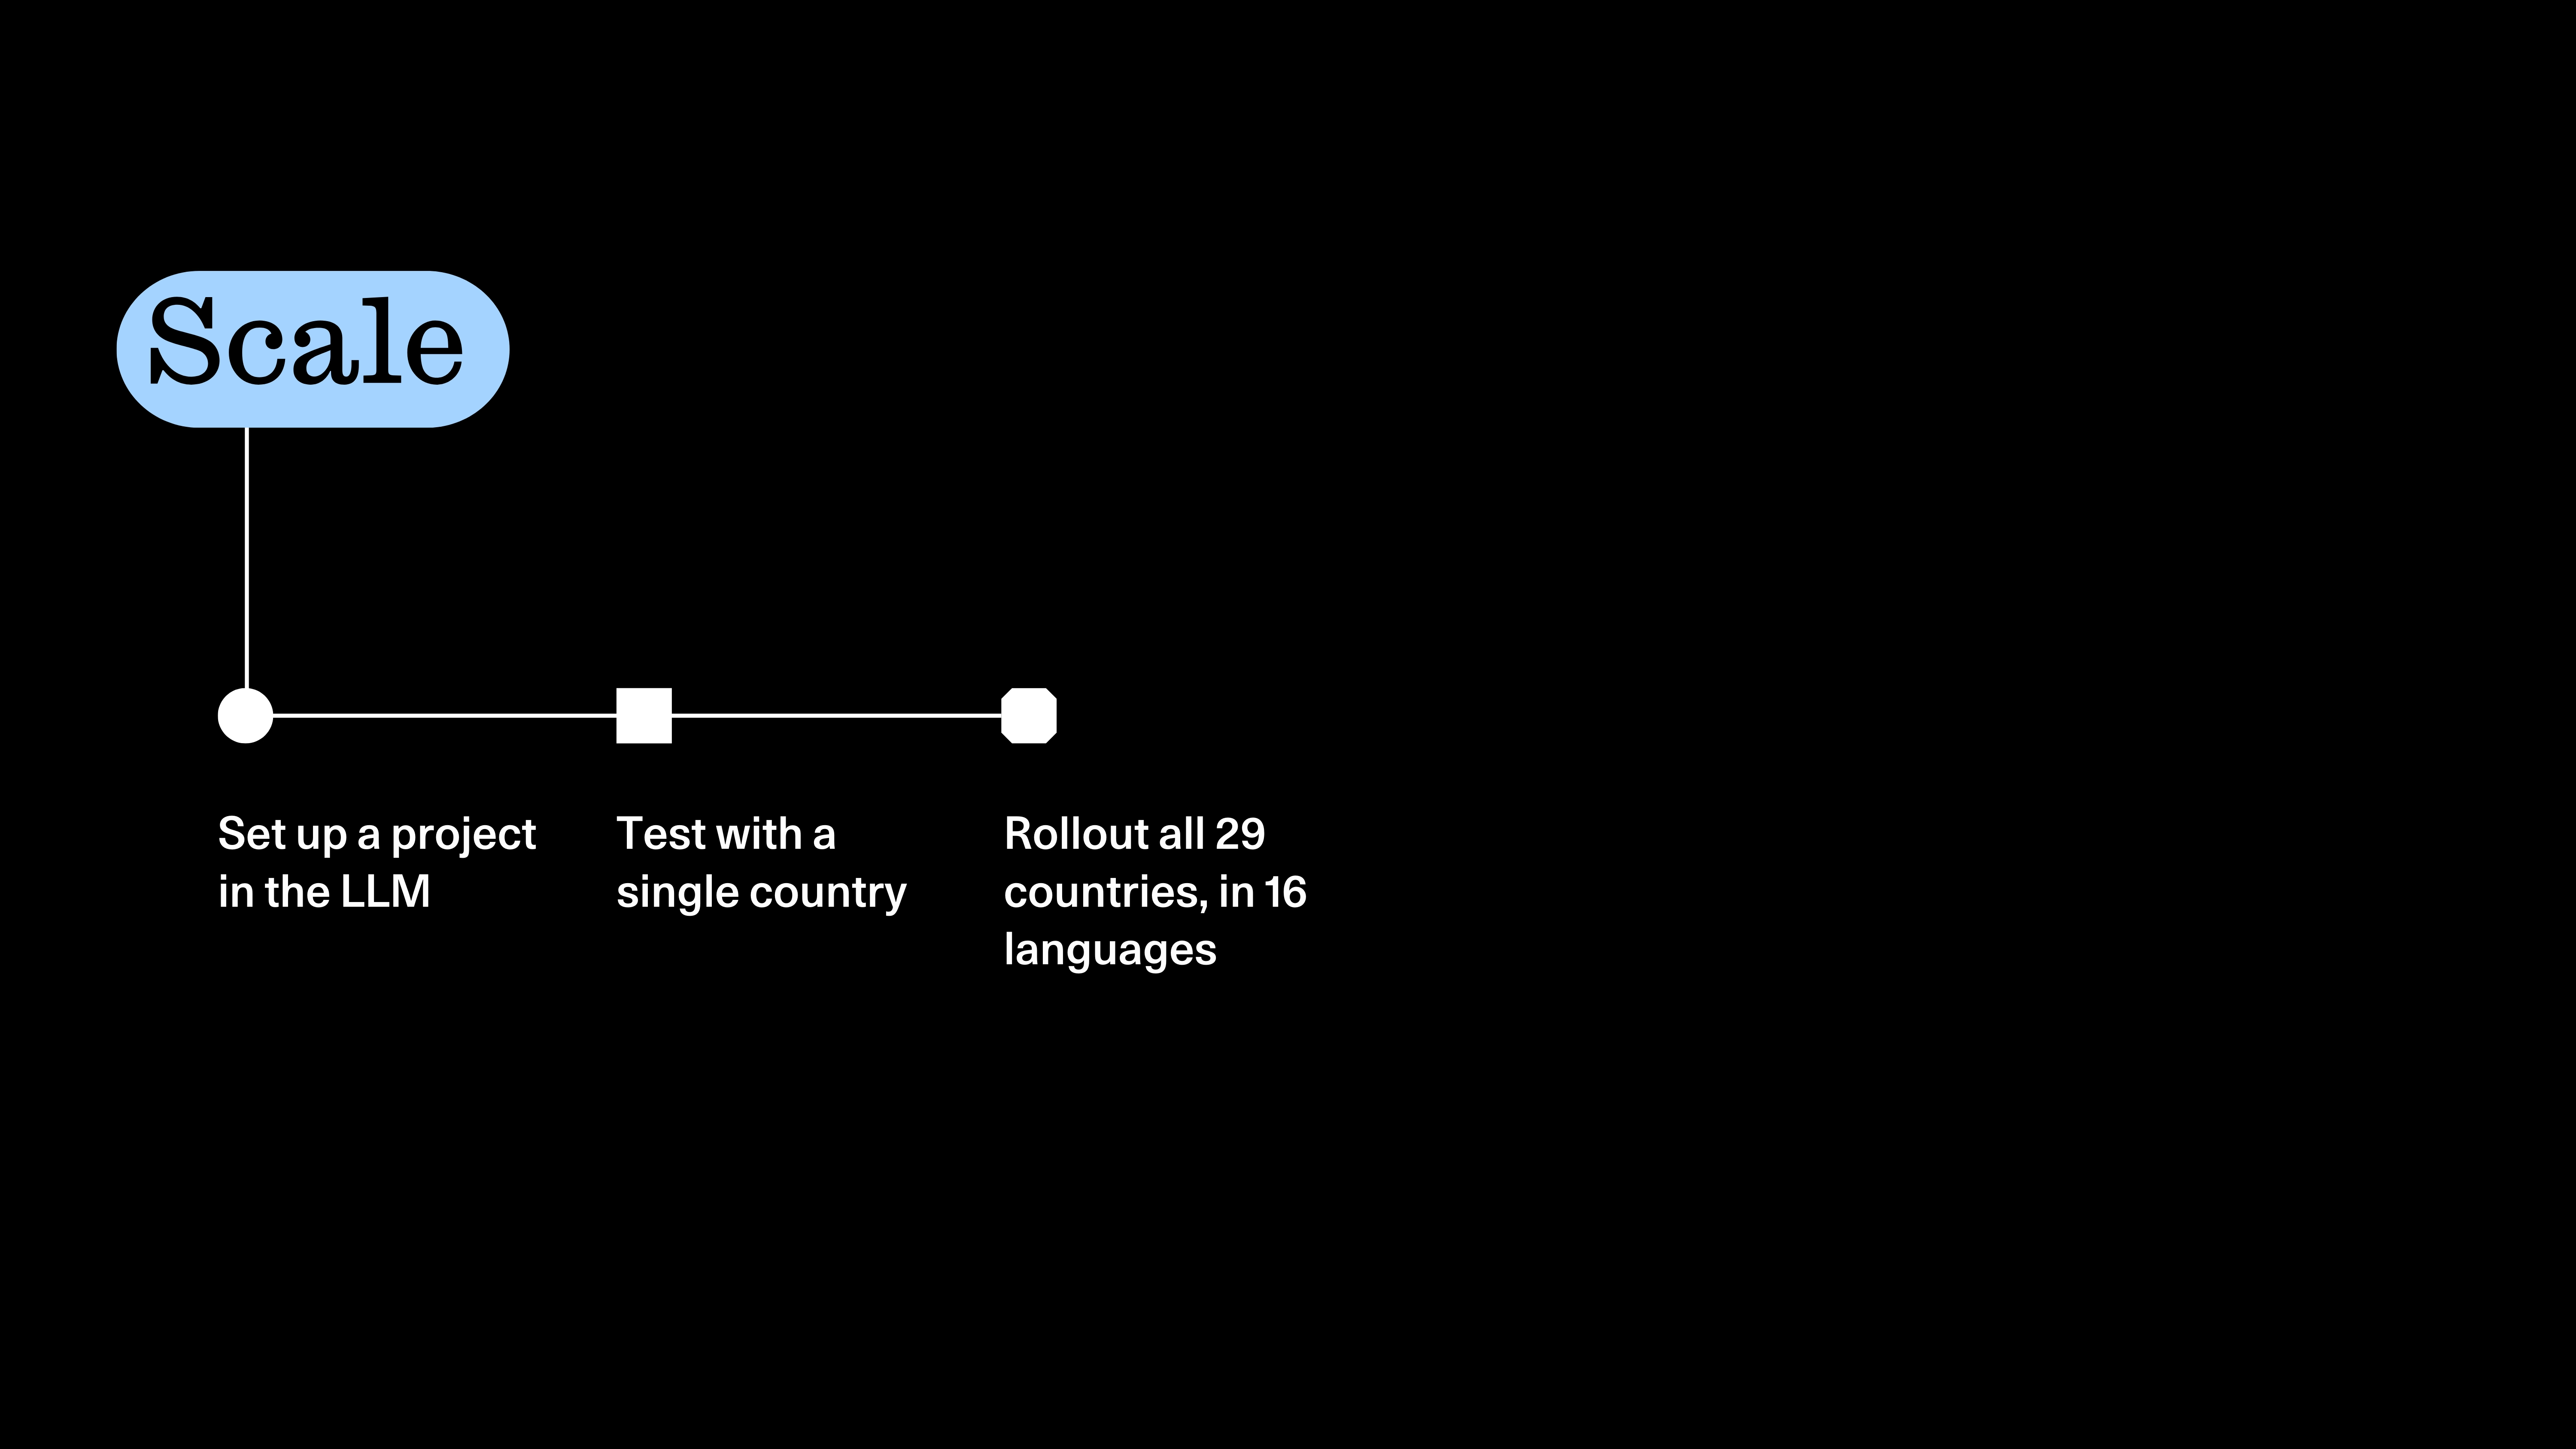
- With the foundation in place, we leveraged an LLM to scale the content outputs.
- Research data was uploaded and carefully mapped, with outputs manually reviewed and spot-checked throughout.
- The workflow was tested with a single market first, allowing us to validate interpretation, identify issues early, and refine the process before scaling.
AI helped handle scale and repetition. Humans remained responsible for interpretation, accuracy, and quality.
Scaling with control across markets
- Once validated, the same workflow was applied across all markets.
- Country-specific reports and content assets were generated from a single central dataset.
- Country-specific reports and supporting content were generated from a single central dataset, rolled out across 29 markets and 16 languages.
- Human review and validation remained in place, while the need for repeated manual reworking was significantly reduced.
Human review and validation remained in place, while the need for repeated manual reworking was significantly reduced.
The value came from combining human judgment with systems designed to support scale, not from automating decisions that mattered.
The redesigned workflow delivered clear, measurable improvements.
- Reports delivered four times faster than in previous years.
- Higher accuracy than prior manual outputs
- 3x year-on-year increase in engagement
- A significant reduction in administrative load for local and regional teams
Rather than replacing human expertise, embedding AI across discovery, planning, and execution allowed teams to spend less time on rework and approvals, and more time applying judgment to how the research was used.